


I am writing in reference to Mr. Ramesh Gampat’s letter published in the Stabroek News edition of January 30, 2025, with the caption: “There were no contradictions in my letter and, based on the data in Budget 2025 and various BoG reports, I can show that Rampersaud’s arguments are spurious”. Editor, I wish to address three main themes that the learned economist, Dr. Gampat proffered therein:
-
- Gampat argued that “the growing gap between imports and non-oil export is a major reason for persistent [foreign exchange] FX shortages. Little, if any, of oil revenues flow into the FX market; Guyana’s share of less than 15 percent is deposited into the NRF. The vast growth disjunction (performance) between imports and exports can only be interpreted as relative stagnation of exports”.
- He assumed that “it does not seem likely that imports by the oil economy are captured by the data: such imports are done directly by oil companies and mostly likely do not pass through local commercial banks”, and
- that “the fiscal deficit should be gauged in relation to non-oil GDP and not total GDP. The literature is unanimous that a persistent fiscal deficit of over 6 percent or so can be a major cause of macroeconomic instability”.
What are the indicators that would signal a real FX shortage or problems?
Gampat is correct in the sense that the causation of the FX constraints may be on account of the exponential rise in total imports and stagnated non-oil exports, albeit partially, not totally. Gampat’s proposition, in this regard, does not tell the full story. In order to determine whether there is a real FX problem or shortage, there are certain indicators that policymakers would have to pay attention to, which Gampat has omitted completely in his analysis. This include, mainly, the import cover, which is an indicator that estimates how many months of imports can be covered with the help of central bank FX reserves. But, to present a more prudent and pragmatic analysis, I have extended the FX reserves to include not only the central bank reserves, but the entire banking sector’s Net Foreign Sector Assets and Reserves (NFSA), together with the closing balance of the Natural Resource Fund (NRF). Effectively, these altogether constitute the Total Net Foreign Sector Assets & Reserves (TNFSA) for the country.
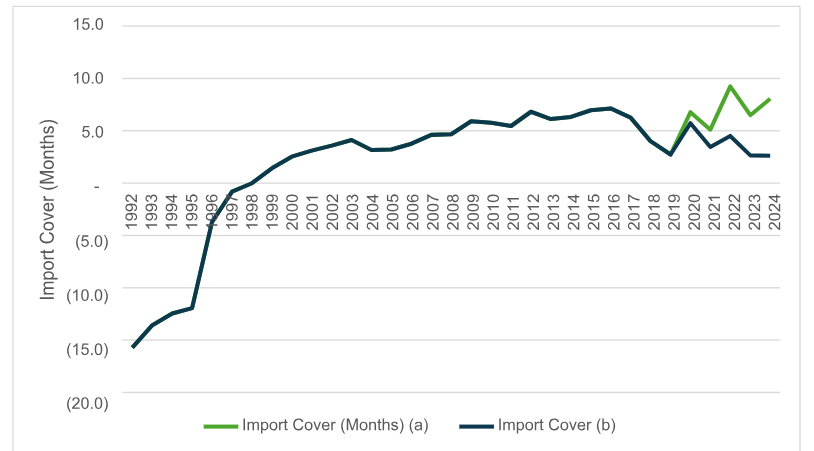
As shown in exhibit 1 below, in 1992, the import cover was in a negative of 15.7 months, meaning that the country had virtually zero FX reserves. The central bank’s net international reserve balance was in the negative, indicating that the bank had to borrow FX from external sources. By 1999, the banking sector began accumulating positive net balances in FX reserves and net foreign sector assets, derived from export earnings and other sources of FX inflows, such as foreign direct investments (FDIs). The chart shows that in 1999, the FX reserves represented 1.4 months import cover, which rose to >3 months import cover in 2001 through 2018. The highest import cover recorded during that period was 7 months in 2016.
In 2019, the import cover (a) fell to 3 months, which rose to ≥5 months during the period 2020- 2024, to reach a record high of 9.2 in 2022 and 8.1 in 2024. Import cover (b), which excludes the NRF balance, during this period (2019-2024), the import cover averaged 3.6 months annually.
As a general rule of thumb, central banks are required to maintain FX reserves covering a minimum of 3 months’ import cover, to be anchored within a macroeconomic stability framework.
And, as noted earlier, I have extended this analysis to include the TNFSA to be practically correct, which shows that the total FX reserves in the financial system covered more than the minimum threshold of 3 months import cover. Worthy of note, the total net foreign sector assets and reserves, which stood at US$916 million in 2019, rose to US$4.6 billion at the end of 2024.
Exhibit 1: Import Cover (a) is calculated based on the Total Net Foreign Sector Assets (TNFSA), which include the Banking Sector Net Foreign Sector Assets & Reserves + the NRF Closing balance, whereas (b) excludes the NRF balance.
Balance of Payments Account
Moreover, a thorough analysis of the Balance of Payment (BoP) account, which was another factor omitted from Dr. Gampat’s analysis, would also help to illustrate the full FX story. In this respect, it would appear that Dr. Gampat relied heavily on examining only the current account balances―that is, the international trade balances (the difference between exports and imports), to validate his argument. Consequently, his argument can be easily invalidated because of the fact he ignored the BoP account. The BoP account records all FX transactions (inflows and outflows of FX) that a country engages with the rest of the world. These transactions are not limited to the current account that captures international trade, which is part of the BoP account as well. The BoP account constitutes both the current and capital accounts. The current account includes the merchandise trade and Services (both factor and non-factor services), Transfers (official and private), whereas the capital account captures Medium- and Long-Term Capital (non- financial public sector capital, external loan disbursements, amortization, SDR allocation, NRF (net), FDIs, and portfolio investment).
Hence, it is crucial to note that the crude oil exports attributed to the oil companies’ share of profit oil and cost oil/cost recovery, would have already been accounted for as FX outflows in the BoP account under the capital account, which Dr. Gampat seems to have forgotten or omitted. This explains why Dr. Gampat’s methodology of relying exclusively on the non-oil export trade balance would inevitably be a skewed approach to the analysis, thereby invalidating his proposition that the rise in imports and stagnated non-oil exports have engendered FX constraints.
Exhibit 2: Balance of Payments Overall Balances
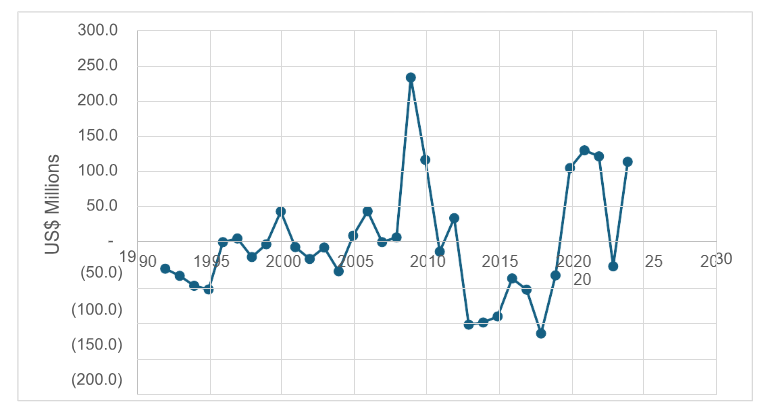
Since 2020, the BoP deficits have been financed principally from the Bank of Guyana’s Net Foreign Sector Assets and Reserves. Further, during this period (2020-2024), the BoP has recorded surplus balances of over US$100 million annually, save and except for the year 2023, when a deficit balance was recorded of US$36 million.
A closer examination of the BoP account over the period 1992-2024, in particular, the source of financing tells a different story. The BoP was financed from various sources, which include: the Bank of Guyana Net International Reserves and Foreign Assets, change in non-financial public sector arrears, change in private sector commercial arrears, debt relief, debt stock restructuring, BoP support (International Monetary Fund (IMF)) and debt forgiveness. Accordingly, the BoP account was financed from debt reliefs for the period 1992-1995, 2000-2003, and 2007-2019, which, over this period, amounted to US$517.2 million. Debt forgiveness accounted for US$602.8 million during the period 2004 – 2019; and BoP support (IMF) accounted for US$117 million during the period 1992-1996. The other sources accounted for a negligible amount, with the exception of the Bank of Guyana Net International Reserve and Foreign Sector Assets, which increased cumulatively since 1992-2024, by US$974.3 million, on account of the BoP surplus balances.
Oil Companies’ Imports
The notion that the oil companies’ imports are not captured in the local economy is inaccurate in the present environment. Prior to the passage of the Local Content Legislation (LCL) in 2021, this notion was in fact true, whereby oil companies were procuring goods and services from suppliers out of Trinidad and Tobago and elsewhere for basic items such as beverages that are manufactured locally in Guyana. However, with the passage of the LCL, this practice has been minimized if not completely discontinued.
Fiscal Deficit
The overall fiscal deficit obtained in 2024 was 5.6% of GDP, with a non-oil fiscal deficit of 22% of GDP. Notwithstanding the IMF’s literature, I differ fundamentally with Gampat’s reasoning on the non-oil fiscal deficit within the Guyana context.
The story that he is selling with the non-oil fiscal deficit argument is essentially distorted for the following reasons: The national budget is financed from the resources generated from the oil economy; therefore, it is prudent to gauge the overall deficit in relation to the overall economy.
For argument’s sake, the fiscal deficit in relationship to the non-oil economy would have to be adjusted, premised on some assumptions: These would include adjusting the budget less the oil revenues, which means that the debt financing of the budget would have been lower, whereby in the pre-oil era, the non-oil fiscal deficit was below 10% of GDP.
Furthermore, the entire budget orientation and fiscal framework would have been different if the oil economy is to be excluded. In other words, if Guyana was not an oil producer, the budget’s fiscal orientation would have remained the same as in the pre-oil period.
Conclusion
The proposition put forward by Dr. Gampat that the rise in imports and sluggish growth in non-oil exports have been contributing to the FX constraints is not an entirely valid notion. As demonstrated in the analysis herein, the total net foreign sector assets and reserves in the financial system inclusive of the NRF―is well above the minimum prudential benchmark of 3 months’ import cover, averaging 7.14 months’ import cover annually over the last five years.