

Summary points
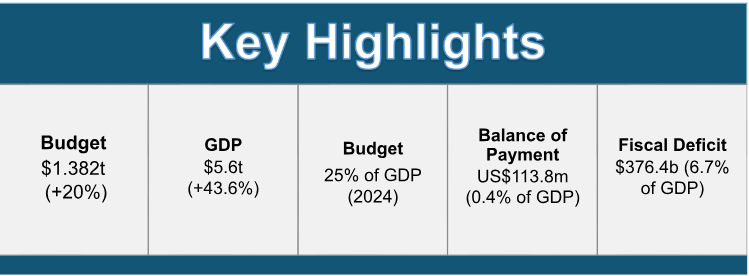
This year’s budget is 20 % larger over budget 2024, amounting to $1.382 Trillion, fully financed with no new taxes. The budget was presented under the theme: “A Secure, Prosperous and Sustainable Guyana”, building on the foundational framework in which the incumbent has had to rebuild since their re-election to the reins of Government in 2020.
Thusly, the macroeconomic performance remains buoyant, with strong growth recorded in the overall economy and in the non-oil economy. This outturn is attributed to the expansionary fiscal policy stance of the Government and the strategic investments in the economy with the view to diversifying the economy within a sustainable development framework, particularly in the non-oil sectors.
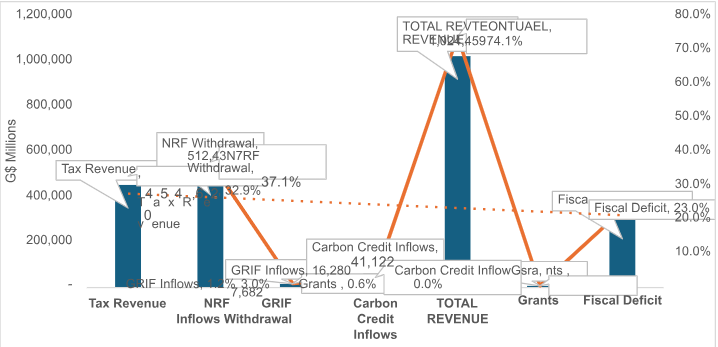
- Budget 2025 will be financed from non-oil revenue (mainly taxes) accounting for 38% followed by the Natural Resource Fund withdrawal (33%), debt financing (23%), carbon credit inflows (3%) and other sources (3%).
- The social services sector budget accounts for 31% of the total budget with an average y- o-y growth of 88%. The housing sector budget accounts for the largest share of the social services sector budget at 32%, followed by health (28%), education (23%), social services (14%), and culture and sports (3%).
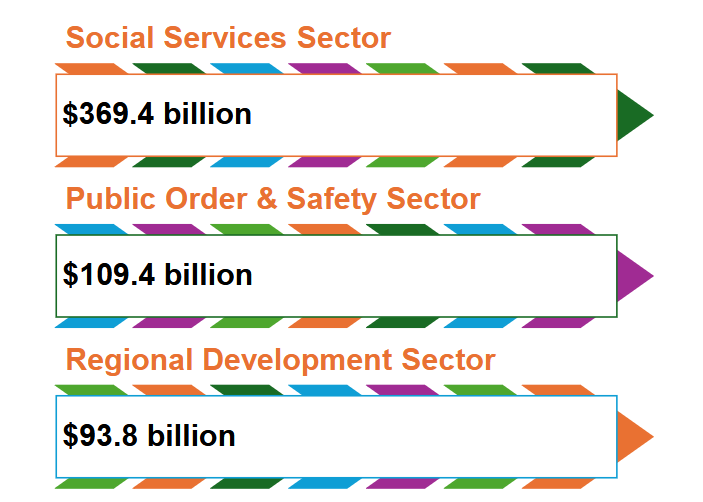
- The budgetary allocation towards regional development has increased by 88% or from $50 billion in 2020 to $94 billion in 2025.
- Budgetary allocation in the infrastructure sector has increased nearly seven-fold, from $46 billion in 2020 to $313 billion in 2025. In the economic sector, budgetary allocations rose from $19.2 billion in 2020 to $76.2 billion in 2025 (297%). In the social services sector, budgetary allocations increased from $80.6 billion in 2020 to $369.4 billion in 2025 (358%). And in the public order and safety sector, the budgetary allocation rose from $43.2 billion in 2020 to $109.4 billion in 2025 (153%).
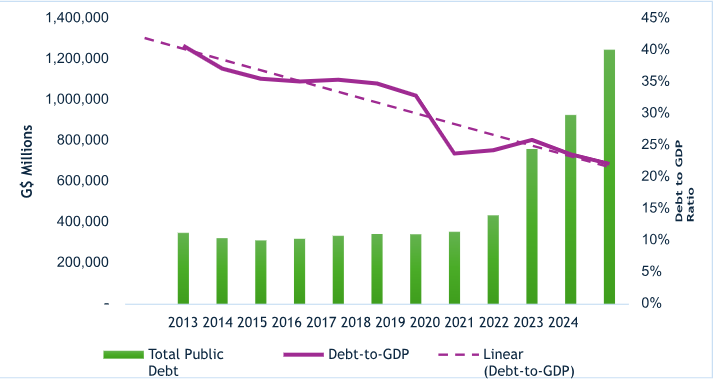
- In 2024, the debt-to-GDP ratio stood at 22% down from 41% in 2013, signaling a low level of debt sustainability risk and a resilient macroeconomic stability framework.
- The nominal interpretation of the “debt burden per household” would only be realized in real terms if the increase in the public debt is accompanied by increase in taxes. However, this has not been the case. The PPP/C Government has been offsetting the increases in debt burden per household with tax reliefs vis-à-vis, reduction in taxes, and both direct and indirect subsidies per household through other measures intended to increase household income.
- Altogether, key budgetary measures in budget 2025 aimed at increasing net disposable income at the household level to combat prevailing cost of living conditions, aggregates to an estimated $324 billion annually.
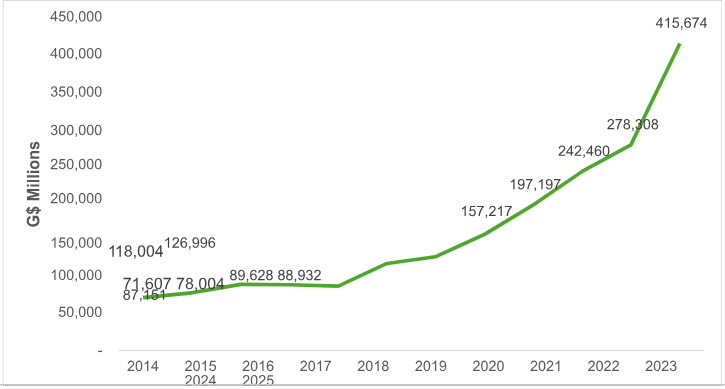
- Net disposable income for individuals extrapolated from the personal income tax data is projected to increase nearly six-fold in 2025 from 2014 levels, from $72 billion in 2014 to $416 billion in 2025.
- The changes in the personal income tax rate from 28% to 25% and from 40% to 35%, has resulted in an effective tax rate of 17%, down from 23%, a reduction by 6 percentage points in the effective tax rate. Resultantly, the increased disposable income that will be had in 2025 is equivalent to, on average, 1.2 months of additional disposable income that was earned in 2020.
- The total net foreign sector assets and reserves in the financial system inclusive of the NRF―is well above the minimum prudential benchmark of 3 months’ import cover, averaging 7.14 months’ import cover annually over the last five years.
- The amended withdrawal rule of the NRF is designed to ensure that the effective rate of withdrawal is kept under 80%, in alignment with the projected growth in the Fund’s size, which was obtained under the old withdrawal rule, all things being equal.
1.Introduction
SphereX’ s budget insights and analysis serves to contribute to the national discourse pertaining to public financial management and economic policy analysis. This budget insights and analysis edition is the third publication since the establishment of the firm in May, 2022.
On January 17, 2025, the National Budget for the fiscal year 2025 was presented by Senior Minister with responsibility for Finance within the Office of the President, Dr. Ashni Singh, to the National Assembly. This year’s budget is 20 % larger over budget 2024, amounting to $1.382 Trillion, fully financed with no new taxes. The budget was presented under the theme: “A Secure, Prosperous and Sustainable Guyana”.
2. Budget 2025 Highlights

3. Social Services Sector Budget
The social services sector budget accounts for 31% of the total budget with an average y-o-y growth of 88%.
Exhibit 2: Social Services Sector Budgetary Allocations

The housing sector budget accounts for the largest share of the social services sector budget at 32%, followed by health (28%), education (23%), social services (14%), and culture and sports (3%).
Exhibit 3: Distribution of Social Services Sector Budgetary Allocations

4. Regional Development Sector
The budgetary allocation towards regional development has increased by 88% or from $50 billion in 2020 to $94 billion in 2025.
Exhibit 4: Regional Development Sector

5.Statutory and Appropriation Expenditure
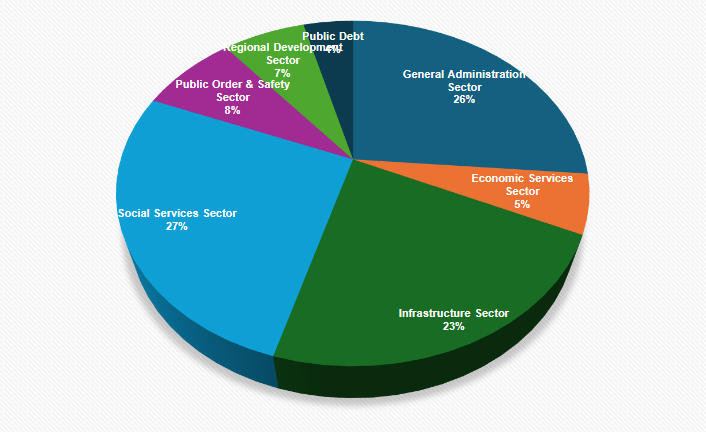
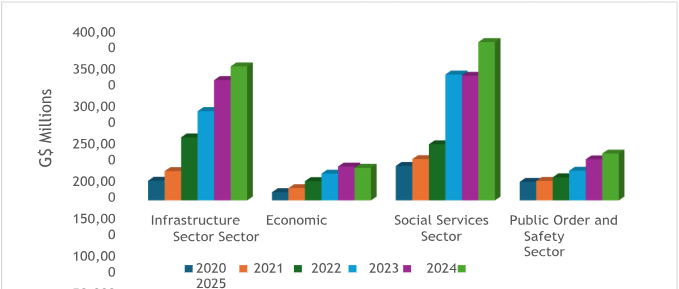
Budgetary allocation in the infrastructure sector has increased nearly seven-fold, from $46 billion in 2020 to $313 billion in 2025. In the economic sector, budgetary allocations rose from $19.2 billion in 2020 to $76.2 billion in 2025 (297%). In the social services sector, budgetary allocations increased from $80.6 billion in 2020 to $369.4 billion in 2025 (358%). And in the public order and safety sector, the budgetary allocation rose from $43.2 billion in 2020 to $109.4 billion in 2025 (153%).
Exhibit 5: Statutory and Appropriation Expenditure by Sector
6. Public Financing and Debt Sustainability
Budget 2025 will be financed from non-oil revenue (mainly taxes) accounting for 38% followed by the Natural Resource Fund (NRF) withdrawal (33%), debt financing (23%), carbon credit inflows (3%) and other sources (3%).
Exhibit 6: Financing of Budget 2025
In 2024, the debt-to-GDP ratio stood at 22% down from 41% in 2013, signaling a low level of debt sustainability risk and a resilient macroeconomic stability framework.
Exhibit 7: Debt-to-GDP Ratio
7. Fiscal Measures


Net disposable income for individuals extrapolated from the personal income tax data is projected to increase nearly six-fold in 2025 from 2014 levels, from $72 billion in 2014 to $416 billion in 2025.
Exhibit 8: Net Household Disposable Income (Personal Income)
Altogether, key budgetary measures hereunder aimed at increasing net disposable income at the household level to combat prevailing cost of living conditions, aggregates to an estimated $324 billion annually.
| Fiscal Measures: Easing COL | GYD$ Millions |
| Reduction in Energy Cost by 50% | 20,000 |
| Abolition of Bridge Tolls (Berbice, Demerara, Wizmar) (Est) | 4,000 |
| Containing Cost of Fuel: 0% Excise Tax | 90,000 |
| Reduction in Freight Charges | 6,000 |
| Continuation of Part Time Job Programme | 11,000 |
| Other Measures/COL Cash Grant | 9,000 |
| Increase in Public Service Wages | 22,964 |
| SUB-TOTAL | 162,964 |
| Supporting the Vulnerable | |
| Old Age Pension | 37,000 |
| Public Assistance | 10,000 |
| Universal Health Voucher | 5,000 |
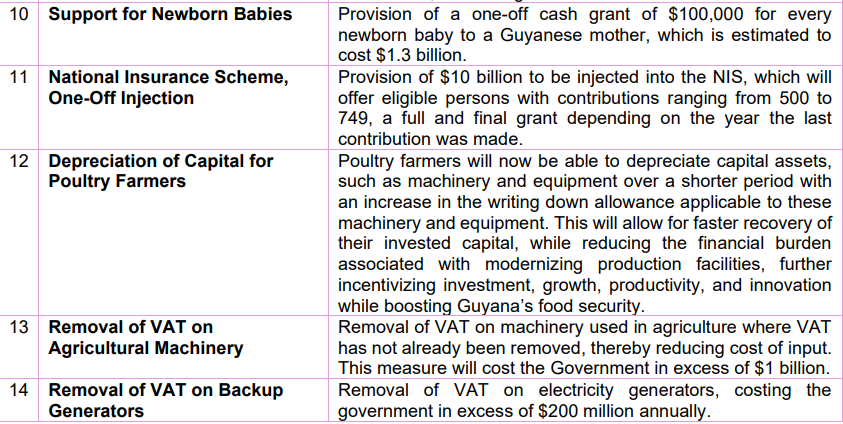
| Support for newborn babies | 1,300 |
| One-off Injection in NIS | 10,000 |
| SUB-TOTAL | 63,300 |
| Other Fiscal Measures | |
| Change in Personal Income Tax | 11,300 |
| Because We Care Cash Grant | 11,000 |
| Free University Education | 13,400 |
| National Cash Grant | 60,000 |
| Adjustment to Taxes for Children | 1,000 |
| Adjustment to Taxes Paid OT | 600 |
| Adjustment to taxes Paid on Second Job | 500 |
| SUB-TOTAL | 97,800 |
| TOTAL | 324,064 |
8. Changes to Personal Income Tax Rate and Threshold
Budget 2025 Changes in Personal and Self-Employed Income Tax Rate and Threshold
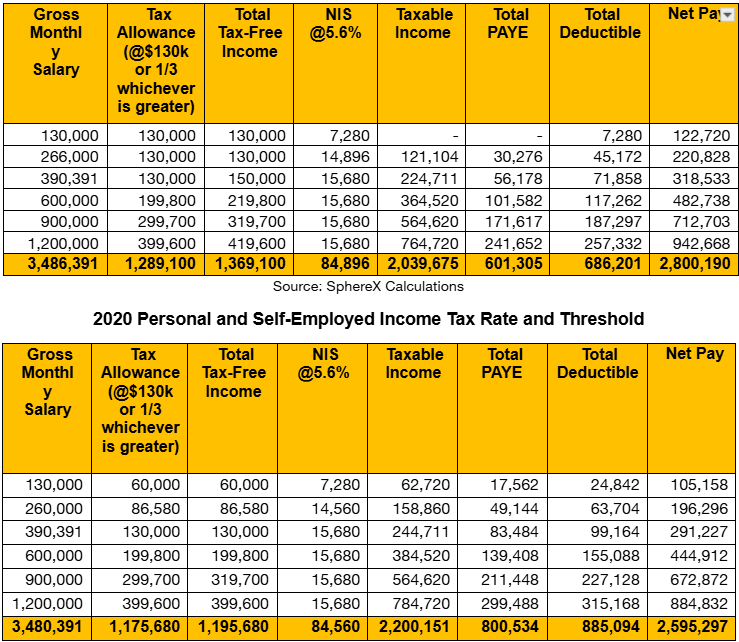
The changes in the personal income tax rate from 28% to 25% and from 40% to 35%, has resulted in an effective tax rate of 17%, down from 23%, a reduction by 6 percentage points in the effective tax rate. Resultantly, the increased disposable income that will be had in 2025 is equivalent to, on average, 1.2 months of additional disposable income that was earned in 2020.
The annualized increase in disposable income from 2020 levels to 2025 based on the aggregate of the examples shown above, approximates to $2.5 million
9. Macroeconomic Issues, Discussion and Analysis
9.1 Foreign Exchange Market
In a self-published book authored by Mr. Ramesh Gampat titled “the Guyanese [foreign exchange) FX Market Modern Discourses and Controversies”, the author contends that:
- The growing gap between imports and non-oil export is a major reason for persistent [foreign exchange] FX shortages. Little, if any, of oil revenues flow into the FX market; Guyana’s share of less than 15 percent is deposited into the NRF. The vast growth disjunction (performance) between imports and exports can only be interpreted as relative stagnation of exports, and
- The fiscal deficit should be gauged in relation to non-oil GDP and not total GDP. The literature is unanimous that a persistent fiscal deficit of over 6 percent or so can be a major cause of macroeconomic instability.
What are the indicators that would signal a real FX shortage or problems?
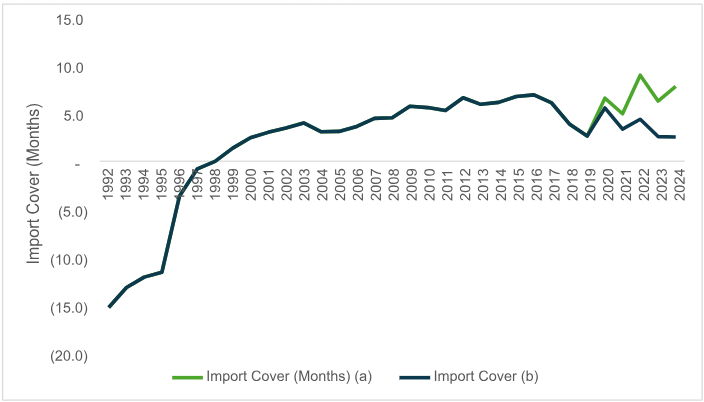
Gampat is correct in the sense that the causation of FX constraints may be on account of the exponential rise in total imports and stagnated non-oil exports, albeit partially, not totally. Gampat’s proposition, in this regard, does not tell the full story. In order to determine whether there is a real FX problem or shortage, there are certain indicators that policymakers would have to pay attention to, which he has omitted. This include, mainly, the import cover, which is an indicator that estimates how many months of imports can be covered with the help of central bank FX reserves. But to present a more prudent and pragmatic analysis, FX reserves include not only the Bank of Guyana (BoG) reserves, but the entire banking sector’s Net Foreign Sector Assets and Reserves (NFSA), together with the closing balance of the Natural Resource Fund (NRF). Effectively, these altogether constitute the Total Net Foreign Sector Assets & Reserves (TNFSA) for the country.
As shown in exhibit 9, in 1992, the import cover was in a negative of 15.7 months, meaning that the country had virtually zero FX reserves. The central bank’s net international reserve balance was in the negative, indicating that the bank had to borrow FX from external sources. By 1999, the banking sector began accumulating positive net balances in FX reserves and net foreign sector assets, derived from export earnings and other sources of FX inflows, such as foreign direct investments (FDIs). The chart shows that in 1999, the FX reserves represented 1.4 months import cover, which rose to >3 months import cover in 2001 through 2018. The highest import cover recorded during that period was 7 months in 2016.
In 2019, the import cover (a) fell to 3 months, which rose to ≥5 months during the period 2020- 2024, to a record high of 9.2 months in 2022 and 8.1 months in 2024. Import cover (b), which excludes the NRF balance, averaged 3.6 months annually.
As a general rule of thumb, central banks are required to maintain FX reserves covering a minimum of 3 months’ import cover, to be anchored within a macroeconomic stability framework. And, as noted earlier, the TNFSA shows that the total FX reserves in the financial system covered more than the minimum threshold of 3 months import cover. Worthy of note, the total net foreign sector assets and reserves, which stood at US$916 million in 2019, rose to US$4.6 billion at the end of 2024.
Exhibit 9: Import Cover (a) is calculated based on the Total Net Foreign Sector Assets (TNFSA), which include the Banking Sector Net Foreign Sector Assets & Reserves + the NRF Closing balance, whereas (b) excludes the NRF closing balance.
Balance of Payments Account
A thorough analysis of the Balance of Payment (BoP) account, which was another factor omitted from Dr. Gampat’s analysis, would also help to illustrate the full FX story. In this respect, it would appear that Dr. Gampat relied heavily on examining only the current account balances―that is, the international trade balances (the difference between exports and imports), to validate his argument. Consequently, his argument can be easily invalidated owing to the fact that he ignored the BoP account. The BoP account records all FX transactions (inflows and outflows of FX) that a country conducts with the rest of the world. These transactions are not limited to the current account that captures international trade, which is part of the BoP account.
The BoP account constitutes the current and capital accounts. The current account includes the merchandise trade and services (factor and non-factor services), transfers (official and private), whereas the capital account captures Medium- and Long-Term Capital (non-financial public sector capital, external loan disbursements, amortization, SDR allocation, NRF (net), FDIs, and portfolio investment).
Hence, it is crucial to note that the crude oil exports attributed to the oil companies’ share of profit oil and cost oil/cost recovery, would have already been accounted for as FX outflows in the BoP account under the capital account, which Dr. Gampat seems to have forgotten and/or omitted. This explains why Dr. Gampat’s methodology of relying exclusively on the non-oil export trade balance would inevitably be a skewed approach to the analysis, thereby invalidating his proposition that the rise in imports and stagnated non-oil exports have engendered FX constraints.
Exhibit 10: Balance of Payments Overall Balances
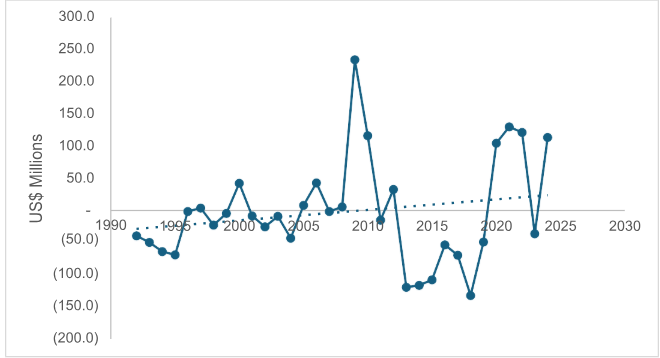
Since 2020, the BoP deficits have been financed principally from the Bank of Guyana’s Net Foreign Sector Assets and Reserves. Further, between 2020-2024, the BoP has recorded surplus balances of over US$100 million annually, save and except for the year 2023, when a deficit balance was recorded of US$36 million.
A closer examination of the BoP account for the period 1992-2024, in particular, the source of financing tells a different story. The BoP was financed from various sources, which include: the Bank of Guyana Net International Reserves and Foreign Assets, change in non-financial public sector arrears, change in private sector commercial arrears, debt relief, debt stock restructuring, BoP support (International Monetary Fund (IMF)) and debt forgiveness. Accordingly, the BoP account was financed from debt reliefs for the period 1992-1995, 2000-2003, and 2007-2019, which amounted to US$517.2 million. Debt forgiveness accounted for US$602.8 million during the period 2004–2019; and BoP support (IMF) accounted for US$117 million during the period 1992-1996. The other sources accounted for a negligible amount, with the exception of the Bank of Guyana Net International Reserve and Foreign Sector Assets, which increased cumulatively since 1992-2024, by US$974.3 million, on account of the BoP surplus balances (net).
Fiscal Deficit
The overall fiscal deficit obtained in 2024 was 6.7% of GDP, with a non-oil fiscal deficit of 22% of GDP. Notwithstanding the IMF’s literature, this author differs fundamentally with Gampat’s reasoning on the non-oil fiscal deficit within the Guyana context.
Exhibit 11: Overall Fiscal Deficit
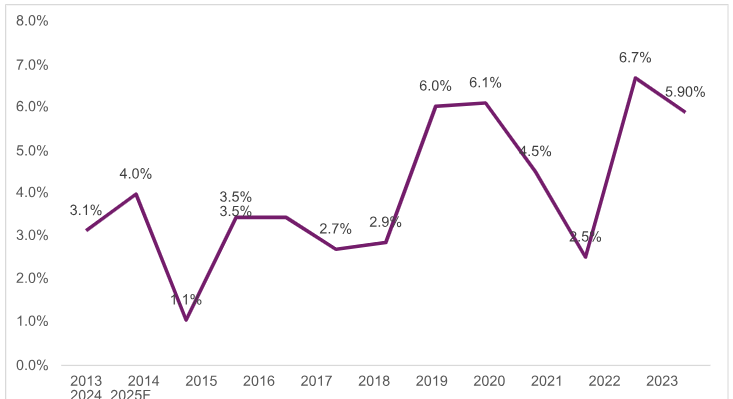
The story that he is selling with the non-oil fiscal deficit argument is essentially distorted for the following reasons: The national budget is financed from the resources generated from the oil economy; therefore, it is prudent to gauge the overall deficit in relation to the overall economy.
For argument’s sake, the fiscal deficit in relationship to the non-oil economy would have to be adjusted, premised on some assumptions: These would include adjusting the budget excluding the oil revenues, which means that the debt financing of the budget would have been lowered to where it was in the pre-oil era, when the non-oil fiscal deficit was below 10% of GDP. Furthermore, the entire budget orientation and fiscal framework would have been reverted to the pre-oil economy. In other words, if Guyana was not an oil producer, the budget’s fiscal orientation would have remained the same as in the pre-oil period.
With the aforementioned background in mind, the proposition put forward by Dr. Gampat that the rise in imports and sluggish growth in non-oil exports have been contributing to the FX constraints is not an entirely valid notion. As demonstrated in the analysis herein, the total net foreign sector assets and reserves in the financial system inclusive of the NRF―is well above the minimum prudential benchmark of 3 months’ import cover, averaging 7.14 months’ import cover annually over the last five years.
9.2 Amended NRF Withdrawal Formula
During the budget 2025 debates, the main opposition political party, the APNU, contends that the amended withdrawal formula of the NRF pursuant to the Fiscal Enactments (Amendment) Act No.2 of 2024, will deplete the NRF, signaling reckless spending and depletion of the Fund at a reckless rate. However, an application of the withdrawal rules, the old versus the new, based on the forecasted deposits into the NRF, disproves this notion as illustrated hereunder.
Exhibit (a)
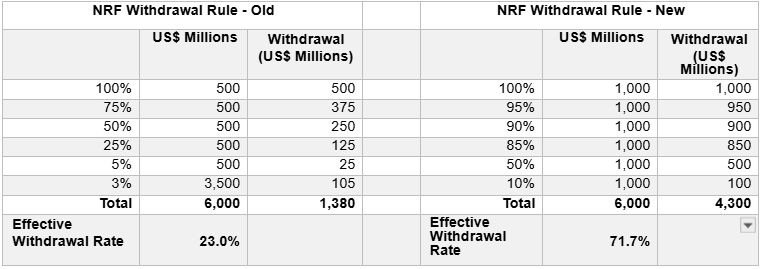
As shown in exhibit (a), under the old NRF withdrawal formula, on a balance of US$6 billion, the maximum withdrawal ceiling is capped at US$1.4 billion, or an effective withdrawal rate of 23%. Whereas, under the amended withdrawal formula, on a balance of US$6 billion, the maximum withdrawal ceiling is capped at US$4.3 billion or an effective rate of 71.7%.
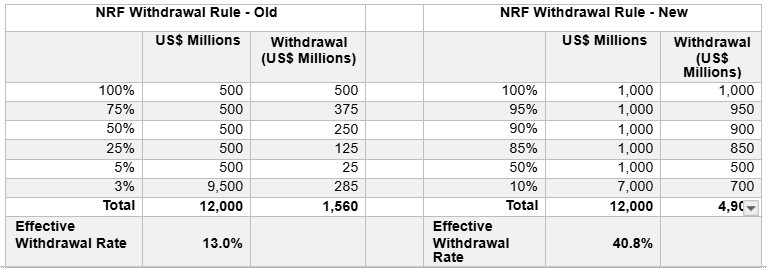
In exhibit (b), under the old NRF withdrawal formula, on a balance of US$12 billion, the maximum withdrawal ceiling is capped at US$1.6 billion, or an effective withdrawal rate of 13%. Whereas, under the amended withdrawal formula, on a balance of US$12 billion, the maximum withdrawal ceiling is capped at US$4.9 billion or 40.8%.
Exhibit (b)
Effectively, these illustrations have disproved the notion that the amended withdrawal rule is designed to deplete the NRF. Rather, the amended withdrawal formula is designed, more so, to sustainably increase the withdrawal ceiling relative to the projected growth of the Fund’s size. In so doing, the amended withdrawal formula can be premised upon two (2) primary factors: (1) It is aimed at minimizing the level of debt financing of the budget, thus maintaining the current low- level of debt-to-GDP ratio of under 30%; and (2) the current production level of oil has already increased nearly six-fold since first oil five-years ago, which is poised to increase more than ten- fold by 2030. This means that the annual deposits into the NRF is projected to increase by at least four-fold, all things being equal.
Summarily, this analysis has demonstrated that the amended withdrawal rule of the NRF is designed to ensure that the effective rate of withdrawal is kept under 80%, in alignment with the projected growth in the Fund’s size, which was obtained under the old withdrawal rule, all things being equal. In other words, the maximum effective rate of withdrawal under the new formula pursuant to the Fiscal Enactments (Amendment) Act No.2 of 2024, has practically remained the same as it was under the old withdrawal formula, in relationship to the projected growth in the Fund’s size.
9.3 Debt Burden Per Household
Another argument put forward during the budget debate in the National Assembly by the political opposition was that budget 2025 will add some $5.9 million in debt per household.
It is worthwhile to note that the total public debt stock was unlawfully understated by the previous APNU+AFC Government between 2015-2020 by over $100 billion, inter alia, the overdraft balances on the Government deposit accounts held at the Bank of Guyana. In 2021, the incumbent government remedied this financial illegality by converting the overdraft into treasury bills, which was then added to the total stock of debt. Henceforth, the total public debt is projected to increase by $1.163 trillion by the end of 2025 from where it was in 2021. With a total household of approximately 300k, the increase in the debt burden per household works out to $3.9 million albeit in nominal terms. This means that the opposition overstated their estimate by $2 million.
Notwithstanding, it is important to note that the increase in the “debt burden per household” would only be realized in real terms if the increase in the public debt is accompanied by increase in taxes. However, this has not been the case. In fact, the PPP/C Government has been offsetting the increases in debt burden per household with tax reliefs vis-à-vis, reduction in taxes, and both direct and indirect subsidies per household through other measures intended to increase household income as outlined in previous sections of this report.
In this respect, net disposable income is projected to increase by $288.8 billion by the end of 2025 to an estimated $415.7 billion from $126.9 billion in 2020 (calculations are based on the personal income tax data and the effective tax rate). Additionally, the indirect Cost of Living (CoL) measures aggregate to an estimated $324 billion, giving rise to a combined total of $612.8 billion increase in household income coupled with household direct and indirect subsidies. The 50% anticipated reduction in electricity cost by the end of the year when the GtE project is realized will add another
$20 billion in savings annually, adding to disposable income at the household level.
By and large, these measures would translate to approximately $2.1 million per household annually.
-
Conclusion
Budget 2025 under the theme “a secure, prosperous, and sustainable Guyana”, builds on the foundational framework in which the incumbent has had to rebuild since their re-election to the reins of Government in 2020. The macroeconomic performance remains buoyant, with strong growth recorded in the overall economy and in the non-oil economy. This outturn is attributed to the expansionary fiscal policy stance of the Government and the strategic investments in the economy with the view to diversifying the economy within a sustainable development framework, particularly in the non-oil sectors.