

Keypoints
The tariff adjustment is not a failure—it’s a signal that Guyana is growing economically. But growth must be managed carefully to avoid unintended consequenceswhereverpracticableoraimtominimizetheimpactofsuchevents. In this case, though largely uncontrollable, local policymakers and negotiators have successfully managed to minimize the potential negative impacts thereto. Understanding these global dynamics helps us prepare smarter policies, protect our gains, and build a sustainable, diversified future.
- The U.S. raised tariffs on Guyanese exports from 10% to 15%, likely in response to evolving trade competitiveness and structural economic shifts.
- A comparative PPP analysis across four Caribbean countries—Guyana, Trinidad& Tobago, Jamaica, and the Dominican Republic—revealed a strong correlation between rising PPP-market rate differentials and higher tariffs.
- Guyana and Trinidad & Tobago both experienced declining PPP conversion factors and rising real competitiveness, corresponding with the higher 15% tariff.
- Jamaica and the Dominican Republic showed increasing PPP rates or stable differentials, reflecting lower real competitiveness, and maintained the 10% tariff.
- The PPP-based approach, though not conclusive, offers a valuable lens for assessing trade recalibrations, especially when paired with Dutch disease risks and graduation from preferential frameworks in the case of Guyana.
BackgroundandContext
Introduction
This policy brief analyzes the economic rationale behind the U.S. tariff increase on Guyanese exports to that market from 10% to 15%. It frames the shift within the broader contextofGuyana’srisingpurchasingpowerparity(PPP),income-basedgraduationfrom trade preferences, and strategic realignments. The data indicate that while the tariff was notexplicitlyjustified,evolvingcompetitivenessandreclassificationofGuyana’seconomic status may have influenced the change. The brief emphasizes that trade recalibration reflects both macroeconomic trends and geopolitical considerations.
Background
InApril2025,theU.S.announcedthefirstwaveoftariffswhereinGuyanawasearmarked for a 38% tariff on Guyanese exports. Subsequently, a 90-days pause was instituted followedbyablanketrateof10%—therebyallowingtimefornegotiations withtheirtrading partners. That 90-days pause expired July 30, 2025. Consequently, effective August 1, 2025, the U.S announced a 5 percentage points upward adjustment to the tariff rate on Guyanese goods—from 10% to 15%. In order to understand the factors that may have impacted this upward revision, this warrants analysis within a broader economic context. Onelocalcommentatorandpracticingcharteredaccountant1wasunreasonablycriticalof theGovernmentofGuyana’s(GoG)supposedfailureinsecuringthe10%alongwithother countries that have managed to maintain the 10% rate.
Thefirstsetoftariffs2 wereformuladriven3 basedonacombinationoffactors:tradedeficit magnitude,nationalsecurityconsiderationsandnegotiationoutcomes.Forcountrieswith large trade surpluses with the U.S., higher tariffs were applied and individualized.
In thecaseof Guyana, the tradesurpluses recorded with theU.S are largely attributedto oil exports. Resultantly, adjustments for the non-oil trade balance that Guyana has with theU.Sremainsinahistoricallydeficitposition.Sufficeittostate,whilenodirectrationale wasprovidedortheformulaforthenewsetoftariffseffectiveAugust1,2025,thestructural transformationofGuyana’seconomyandshiftsinrelativepricecompetitivenessmayhave informed the underlying policy recalibration. This brief seeks to contextualize the tariff revision through the lens of purchasing power parity (PPP), income classification dynamics, and emerging strategic consideration.
1https://www.stabroeknews.com/2025/08/02/news/guyana/ram-flays-govt-over-15-trump-tariff/
2 https://www.aljazeera.com/news/2025/8/1/trump-sets-new-tariffs-on-dozens-of-countries-exports
3https://www.whitehouse.gov/presidential-actions/2025/04/regulating-imports-with-a-reciprocal-tariff-to-rectify-trade-practices-that-contribute-to-large-and-persistent-annual-united-states-goods-trade-deficits/
Methodology
This analysis is based onpublicly availablemacroeconomicdatasourcedfromtheWorld Bank,specificallythePPPconversionfactor(LCUperinternationaldollar)andthemarket exchangerate(LCUperUSD)foreachcountry.Theperiodunderreviewspansfrom2012 to 2024. To measure real exchange rate misalignment, the percentage differential is calculated between the market exchange rate and the PPP conversion factor (PPP rate) for each year. This percentage reflects the degree to which the nominal exchange rate diverges from the real purchasing power parity baseline. A higher differential indicates greater real undervaluation—implying that the country’s goods are cheaper in USDterms—while a lower or negative differential reflects real overvaluation or reduced-price competitiveness. The differential trends were then analyzed comparatively across Guyana, Trinidad & Tobago, Jamaica, and the Dominican Republic to determine their potentialinfluenceonobservedtariffoutcomes.Visualizationofthedatafurthersupported trend alignment and interpretation. This was done by applying the following formula:
Differential(%)=[(MarketExchangeRate−PPPConversionFactor)÷PPPConversion
Factor] ×100
AnalysisandDiscussion
GraduationfromPreferentialTradeEligibility
Guyana’s upward income trajectory—driven in part by oil exports—has likely led to a reclassificationofitstradeeligibilitystatusunderU.S.frameworkssuchastheGeneralized System of Preferences (GSP) or the Caribbean Basin Initiative (CBI). Countries that exceed certain per capita income thresholds often lose access to preferential tariff rates. The tariff hike may reflect Guyana’s improved capacity to absorb standard WTO- consistent tariff schedules.
PPPDynamicsandTariffOutcomes:AComparativeInsight
An analysis of the PPP conversion trends across four Caribbean economies—Guyana, Trinidad and Tobago (T&T), Jamaica, and the Dominican Republic (DR)—offers compelling support for the hypothesis that PPP movements may have influenced the recent U.S. tariff adjustments, albeit not as a primary determinant.
Between 2012 and 2024, both Guyana and T&T experienced a decline in their PPP conversionfactors,suggestingthattheircurrenciesstrengthenedrelativetotheU.S.dollar in PPP terms. This trend indicates enhanced price competitiveness—goods and services fromthesecountriesbecamecheaperinUSD-equivalentterms,potentiallyboostingtheir export attractiveness. In contrast, Jamaica and the Dominican Republic exhibited rising PPPratesoverthesameperiod.ThisdenotesarelativeerosioninPPP-adjustedvalueof theircurrencies,makingtheirdomesticgoodsmoreexpensivewhenpricedinUSD.Such dynamicsimplyadiminishedpricecompetitivenesscomparedtotheU.S., likelyreducing trade friction from a tariff standpoint.
These opposing PPP trends align with observed tariff decisions: GuyanaandT&Twere assigned a 15% tariff, while Jamaica and DR retained a lower 10% rate. While PPP alone may not be a formal determinant in tariff calculations, the correlation between real exchange competitiveness and tariff outcomes is notable. This suggests that PPP considerations—explicitly or implicitly—may have influenced the U.S’s trade policy recalibrations, coupled with the outcomes of negotiations.
AlthoughthePPPframeworkislargelytheoreticalwithitsanalyticallimitations,itremains a useful lensfor interpreting relative competitiveness and its implicationsfor trade policy. Moreover, when juxtaposed with the Dutch disease phenomenon—whereby resource- driven appreciation can undermine non-resource sectors, such as the manufacturing sector—the argument for maintaining a stable yet flexible exchange rate regime becomes more pronounced. Policymakers must therefore ensure that real exchange dynamics do not inadvertently invite corrective measures such as punitive tariffs.
Guyana:PPPTrendsandRelative Competitiveness
Between 2012 and 2024, Guyana’s PPP multiple increased from 1.94 to 2.76—signaling an increasing divergence between the market exchange rate and the real purchasing power of the Guyanese dollar. The PPP conversion factor fell from 105 in 2012 to 78 in 2024,markinga25.7%declineinabsolutetermsoverthetwelve-yearperiod.Themarket exchange rate (nominal) depreciated marginally by 5.3% between 2012 and 2024. This trend implies that Guyanese goods have become relatively cheaper in USD-equivalent termsovertime,enhancingtheirpricecompetitivenessininternationalmarkets.Whilethis may not constitute a basis for punitive trade policy, it presents a compelling economic signal often examined in tariff reviews.
Figure1:Guyana’sPPPMultiplevsMarketExchangeRateandConversionFactor
(2012–2025)
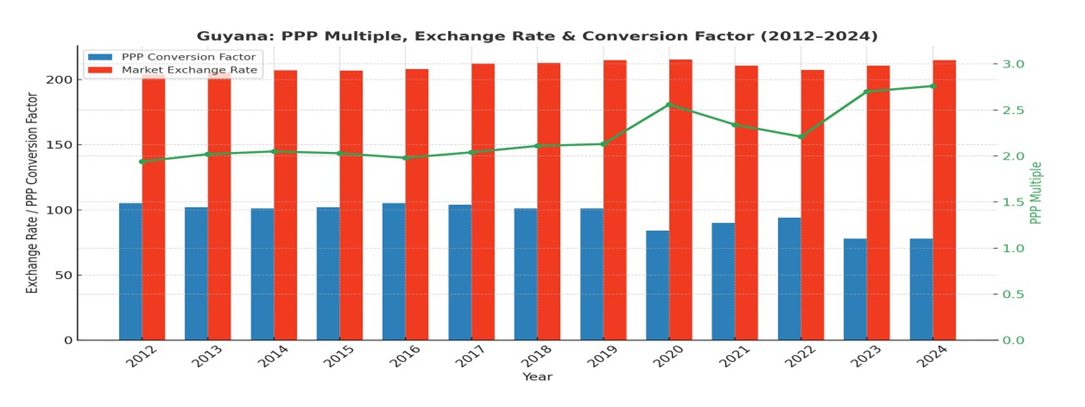
Figure 2: Trinidad & Tobago’s PPP Multiple vs Market Exchange Rate and Conversion Factor (2012–2025)
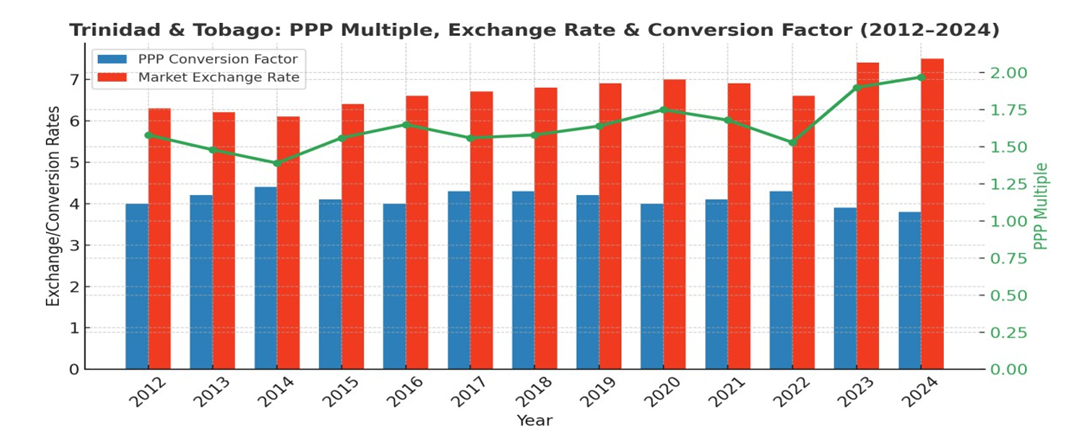
Similarly, Trinidad & Tobago’s PPP conversion factor fell from 4.10 in 2012 to 3.62 in 2024, reflecting a decrease of 12% over the twelve-year period, while the market exchange rate gradually rose from 6.43 to 6.75 TTD/USD. The PPP multiple thus increased from 1.57 to 1.86, reflecting a real depreciation of the currency. The market exchange rate was depreciated by 5% during this period. LikeGuyana, this trend signals increased export competitiveness,leading to a 15% U.S. tariff as well, aligning with the broader pattern of higher tariffs applied to countries with stronger PPP-adjusted competitiveness.
Figure 3: Dominican Republic’s PPP Multiple vs Market Exchange Rate and Conversion Factor (2012–2025)
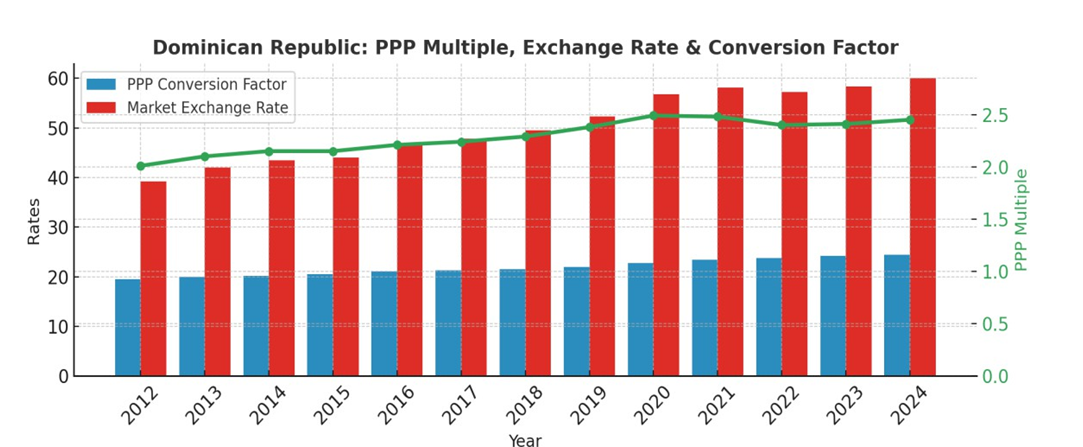
Conversely, the Dominican Republic saw its PPP rate rose from 20.08 to 23.52 over the same time horizon, alongside a climb in market exchange rates from 39.2 to 59.57 DOP/USD.ThePPPmultipleincreasedmoderatelyfrom1.96to2.53.Thistrendsuggests domestic price levels have risen relative to the U.S., weakening export price competitiveness. The country’s retention of a lower 10% tariff supports the view that real currencyappreciationmayreducetheperceivedneedfortradeprotections.
Figure4: Jamaica’s PPP Multiple vs Market Exchange Rateand Conversion Factor (2012–2025)
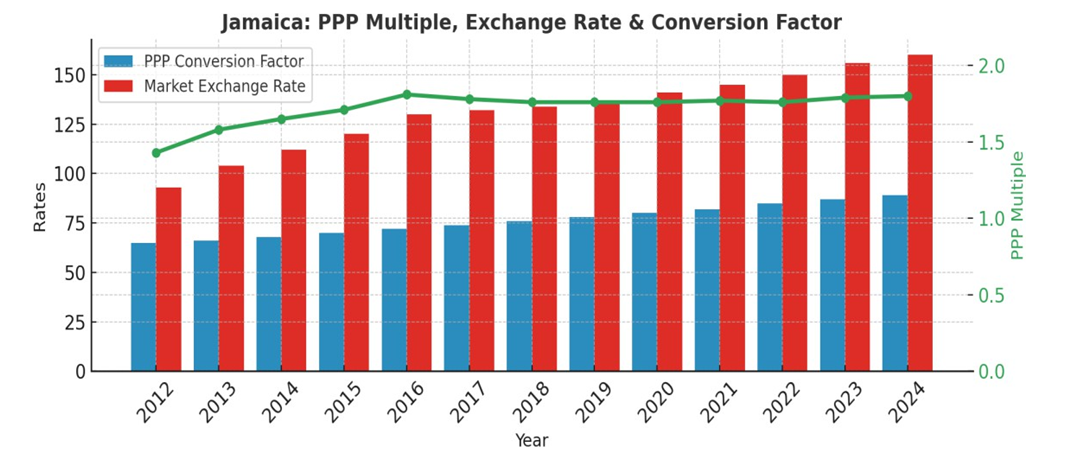
Jamaica’s PPP rate grew from 56.61 to 94.16, while the exchange rate increased from
88.75 to 156.44 JMD/USD. Its PPP multiple rose from 1.57 to 1.66, showing relatively
stable but slightly weakening competitiveness. Like the Dominican Republic, Jamaica was
assigned a 10% tariff, reflecting the more modest movement in real exchange
competitiveness.
Figure 5: Consolidated PPP Analysis and Exchange Rate Differential Trends (PPP
Rates and Market Rates: 2014-2024)
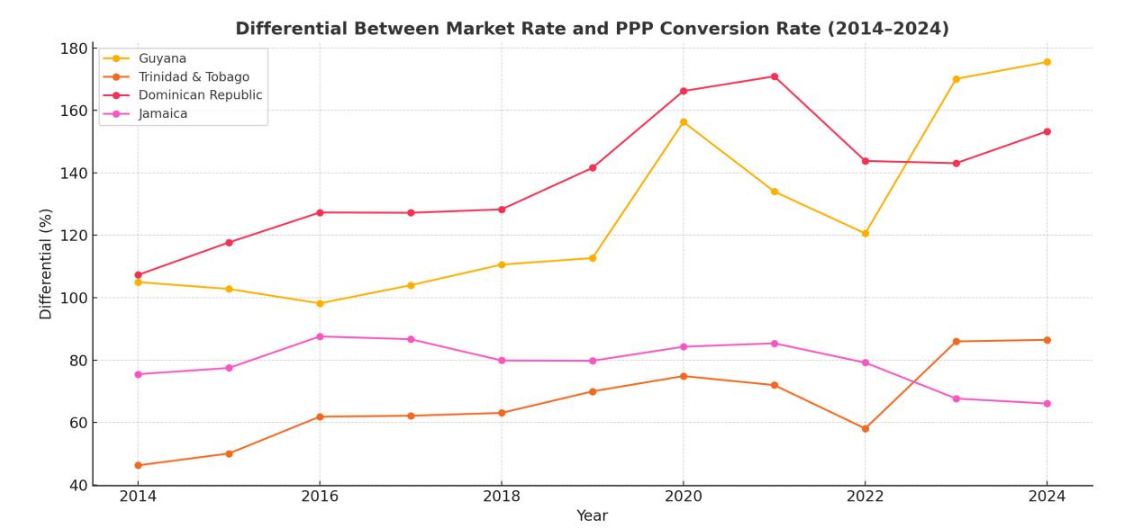
This consolidated analysis compares PPP conversion factors, market exchange rates, and
their resulting differentials across Guyana, Trinidad & Tobago, Dominican Republic, and
Jamaica over the 2014–2024 period. The differential (%) between market rates and PPP
rates indicates real exchange rate misalignments, which reflect price competitiveness and
can influence trade policy decisions such as tariff assignments.
Key Observations:
• Guyana shows the sharpest real appreciation, with the differential rising from 105%
in 2014 to 175.5% in 2024. This suggests a strong price competitiveness
advantage, which aligns with the 15% U.S. tariff imposed on its exports.
• Trinidad & Tobago also experienced growing real appreciation, with the differential
widening from 46.3% to 86.5%. While less dramatic than Guyana’s, this increase
supports the 15% tariff as a policy response to enhanced competitiveness.
• Dominican Republic displayed consistent real depreciation until 2021, when the
differential surged to 170.9%, later stabilizing to 153.3%. The relative
competitiveness was less aggressive than Guyana, correlating with a lower 10%
tariff.
• Jamaica, in contrast, showed a moderate early-period depreciation but then a
narrowing differential—declining from 87.6% in 2016 to 66.1% in 2024—indicating
stable real exchange alignment and more limited trade leverage, consistent with a
10% tariff.
Stable Exchange Rate, Declining Conversion Factor
Despite rapid economic expansion, Guyana’s nominal exchange rate has remained
relatively stable. Meanwhile, the PPP conversion factor declined from 101 in 2018 to 78
in 2024. This combination reinforces the argument that the local cost structure—especially
for non-tradables—remains low relative to U.S. benchmarks. Such asymmetries are not
evidence of manipulation, but they may invite scrutiny within trade competitiveness
assessments.