


Key Highlights
- Over the last two decades (2001-2023), total public debt increased threefold (from $276b to $940b), representing 24% of GDP at the end of 2023;
- GDP (the economy’s productive output) increased by nearly thirtyfold (2,829%) or 10x the level of increase relative to public debt (from $133b to $3.9t);
- Non-oil GDP (the non-oil economy productive output) increased ninefold (827%) or 3x the level of increase relative to public debt (from $133b to $1.2t), representing 32% of GDP at the end of 2023;
- Central Government Revenue increased twelvefold (1,110%) or 4x the level of increase relative to public debt (from $49.4b to $598b) representing 15% of GDP at the end of 2023;
- National income increased thirteenfold (1,209%) or 4x the level of increase relative to public debt (from $86b to $1.12t), representing 29% of GDP at the end of 2023;
- Guyana’s total debt, which includes both public and private sector debt represented 35% of GDP at the end of 2023. This is 203 percentage points below the global debt-to-GDP as of 2022, which stood at 238%; and The global public debt-to-GDP was 92% in 2022, whereas Guyana’s public debt-to GDP is less than 30% of GDP, about 65 percentage points below the global level.
Executive Summary
Debt is neither bad nor good. Debt facilitates the creation of wealth, viz-á-viz, increasing the money supply, thereby increasing wealth. But debt has to be managed sustainably because there are multiple risks associated with debt. When debt is undertaken to finance consumption expenditure, this should always be contained to a minimal extent. Consumption activities do not generate future income streams. Debt financing, on the other hand, when channeled towards productive activities that would generate and expand future income streams is necessary, albeit within a sustainable framework.
With that in mind, debt is not an isolated, absolute variable. Debt is dependent on other variables. Primarily, debt is relative to (1) the productive capacity (potential future revenue streams) and productive output (current levels of production) of a country in the case of public debt, of a firm in the case of corporate debt, of an individual in the case of household debt. Thus,
debt is also relative to (2) the revenue (cash flow) derived from the productive activities, and (3) relative to the market value of total assets utilized to generate the productive output when put to work. Generally, these are the fundamentals that are of key importance to always bear in mind when conducting a debt sustainability analysis, whether it is within a household context, corporate context, or a country’s context.
In the case of a country, the productive assets of a country include the physical resources, human resources (population), and the natural resources. The productive activities carried out by individuals, firms, and the State/Government, in turn generate national income and/or wealth for the country, its people (households) and firms (Gross Domestic Product (GDP)).
Over the last two decades (2001-2023), total public debt increased threefold (from $276b to $940b). Considering this, it is worth noting that for the same period, GDP (the economy’s productive output) increased by nearly thirtyfold (2,829%) or 10x the level of increase relative to public debt; non-oil GDP (the non-oil economy’s productive output) increased ninefold (827%) or 3x the level of increase relative to public debt; central government revenue increased twelvefold (1,110%) or 4x the level of increase relative to public debt; household net income increased twelvefold (1,080%) or 4x the level of increase relative to public debt; business enterprises net income increased eighteenfold (1,676%) or 4x the level of increase relative to public debt; and altogether, national income increased thirteenfold (1,209%) or 4x the level of increase relative to public debt.
In light of the foregoing, wherein the level of debt employed is relative to other factors such as current levels of income and productivity as well as future income earning potential, based on the investments undertaken therefor. The economy’s productive, income and/or wealth generating capacities have far outpaced the level of debt undertaken that was partially attributed to these outcomes.
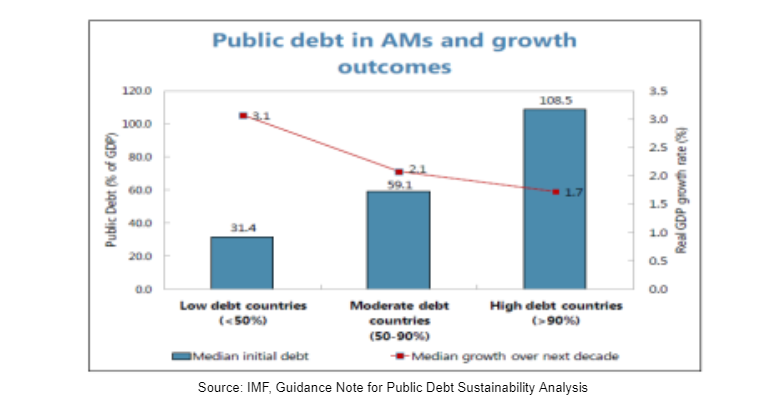
Therefore, it is safe to conclude that Guyana’s public debt indicators are well below the low-risk category in accordance with the IMF risk profile benchmarks, whereby countries with a debt-to-GDP ratio of >50% are considered low risk, 50-90% are considered moderate risk and <90% are considered high risk. To this end, public debt-to-GDP ratio is 24% as of 2023, which is projected to increase by three (3) percentage points at the end of 2024. The public debt service indicators are also well within the low-risk range, with a debt service-to revenue ratio of 6% and non-oil revenue of 9.5%, down from a high of 125% in 2001.
Moreover, Guyana’s total debt, which includes both public and private sector debt represented 35% of GDP at the end of 2023. This is 203 percentage points below the global debt-to-GDP as of 2022, which stood at 238%. The global public debt-to-GDP was 92% in 2022, whereas Guyana’s public debt-to-GDP is less than 30% of GDP, about 65 percentage points below the global level.
Taken together, all of Guyana’s debt indicators are well within the low-risk range and more importantly, far below the global levels. This trajectory is expected to remain in the low-risk range over the near to medium term.
Introduction
The national budget for 2024 is financed by 37% debt including both domestic and external sources, which translates to a fiscal deficit of 8.5% of GDP. The political opposition contends that the level of increase in the debt may not be sustainable, a view which is endorsed by other segments of commentators within the public sphere. However, this author contends that the proponents of this view have failed to examine the broader debt sustainability framework, which would show, as illustrated herein, that all of the debt sustainability indicators are well within the a low-risk category. More importantly, the impact of debt on the economy’s productive output, both within the context of the public and private sectors’ context, as well as household income have been ignored. This article seeks to address these dimensions of the discussion and analysis.
Global Context
Total global debt (public plus private debt stocks) declined 10 percentage points of GDP and reached 238% of GDP in 2022. In U.S dollars, global debt remained stable at US$235 trillion. The fall in public debt slowed compared to the previous year, as it fell 3.6 percentage points of GDP to 92% of GDP in 2022. The fall over the last two years reversed about half of the surge during the pandemic.
Private debt by households and non-financial corporations made the largest contribution to the overall decline, as it dropped to 6.4 percentage points of GDP to 146% of GDP in 2022. In many countries, especially in advanced and emerging markets excluding China, private debt is now below pandemic levels.
The two years of large declines, amounting to 20 percentage points of GDP, only partially reversed the spike from the pandemic, as global debt remained 9 percentage points above its pre-pandemic level in 2022.
Global debt appears to have returned to its historical upward trend. Managing debt vulnerabilities should be key.
Discussion and Analysis
Debt Burden and Debt Profile Risks Benchmarks
While the same debt burden indicators are used for emerging markets (Ems) and advanced economies (AEs) (general government debt in percent of GDP and gross public financing requirements in percent of GDP), different indicators are used for debt profile risks.
Signal-approach benchmarks
The signal approach developed by Kaminsky et.al (1998) was used to derive “benchmarks” for debt burden and debt profile risks indicators. These benchmarks indicate the level of the indicator that best predicts the occurrence of a debt distress event in the sense that it minimizes the sum of the missed crises and false alarms.
| Signal-approach Benchmarks for Ems |
| Debt burden indicators Indicative Benchmarks |
| Gross government debt (% of GDP) 60 |
| Gross public sector financing requirements % of GDP 15 |
| Debt profile indicators |
| EMBI global spreads (basis points) 800 |
| External financing requirements (% of GDP) 20 |
| Public Debt in foreign currency (share of total) 80 |
| Annual change in the share of short-term public 1.5 |
| Debt to maturity |
| Signal-approach Benchmarks for AEs |
| Debt burden indicators Indicative Benchmarks |
| Gross government debt (% of GDP) 70 |
| Gross public sector financing requirements % of GDP 20 |
| Debt profile indicators |
| EMBI global spreads (basis points) 800 |
| External financing requirements (% of GDP) 35 |
| Public Debt in foreign currency (share of total) 2 |
| Annual change in the share of short-term public 60 |
| Debt to maturity |
Why does the level of debt, in addition to its trend, matter in assessing sustainability?
- High debt levels are associated with lower subsequent growth. This can perpetuate recessions and worsen the debt outlook.
- High debt requires large primary surpluses just to stabilize the level of debt, let alone decrease it. Sustaining high primary surpluses for several years can be difficult.
- High debt increases vulnerability to growth shocks and reduces the scope for countercyclical fiscal policy.
- For a given maturity structure, high debt generally means high rollover requirements, which increases the sovereign’s vulnerability to market risk and magnifies the impact of an interest rate shock on the debt-to-GDP ratio.
Debt Sustainability Levels Vary by Country
At a conceptual level:
The maximum sustainable level of debt for a country depends on country specific factors. These include a county’s (i) ability to generate primary surpluses, and therefore services its debt; (ii) growth prospects; (iii) cost of borrowing that reflects both the interest cost of debt already contracted and market perceptions of a country’s ability to service future borrowings; (iv) history of meeting its debt obligations (whether it had debt distress/lost market access); (v) vulnerability to shocks; (vi) nature of investor base; and other factors.
At an empirical level:
Experience shows that some countries have run into debt difficulties at relatively low debt levels, while others have been able to sustain high levels of indebtedness for prolonged periods without experiencing debt distress. Argentina defaulted when its debt was around 60% of GDP while Japan has continued to sustain a debt-to-GDP ratio of 150%. There is no common level across countries at which debt has been perceived to become unsustainable. Public debt varies widely across countries for a given level of sovereign spreads. That two countries with very different levels of public debt have similar spreads reflects the important role country-specific factors play in market participants’ perception of sovereign risk.
Public Debt Sustainability Indicators
Debt is neither bad nor good. Debt facilitates the creation of wealth, viz-á-viz, increasing the money supply, thereby increasing wealth. But debt has to be managed sustainably because there are multiple risks associated with debt. When debt is undertaken to finance consumption expenditure, this should always be contained to a minimal extent. Consumption activities do not generate future income streams. Debt financing, on the other hand, when channeled towards productive activities that would generate and expand future income streams is necessary, albeit within a sustainable framework.
With that in mind, debt is not an isolated, absolute variable. Debt is dependent on other variables. Primarily, debt is relative to (1) the productive capacity (potential future revenue streams) and productive output (current levels of production) of a country in the case of public debt, of a firm in the case of corporate debt, of an individual in the case of household debt. Thus, debt is also relative to (2) the revenue (cash flow) derived from the productive activities, and (3) relative to the market value of total assets utilized to generate the productive output when put to work. Generally, these are the fundamentals that are of key importance to always bear in mind when conducting a debt sustainability analysis, whether it is within a household context, corporate context, or a country’s context.
In the case of a country, the productive assets of a country include the physical resources,
human resources (population), and the natural resources. The productive activities carried out
by individuals, firms, and the State/Government, in turn generate national income and wealth for
the country, its people (households) and firms (Gross Domestic Product (GDP)).
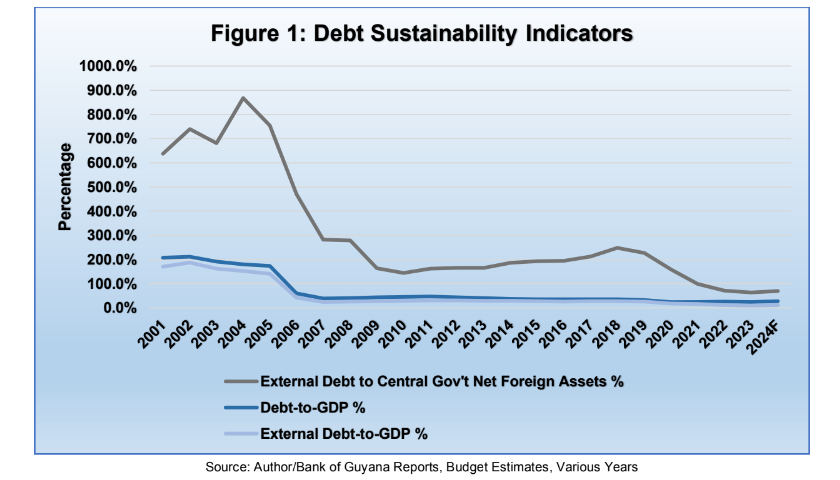
Over the last two-decades (2001-2023), Guyana’s debt-to-GDP ratio fell from 207% in 2001 to
24% in 2023 based on 2024 growth forecast for GDP and debt, is expected to remain below
30% (27% of GDP) for the fiscal year 2024. The external debt-to-GDP ratio fell from a high of
169.5% in 2001 to 9.5% in 2023 and 11.3% of 2024 based on projected growth. The external
debt-to-net public sector foreign assets fell from 638% in 2001 to 63.5% in 2023, and 69.5% for
2024 based on projected growth. In nominal terms, total public debt increased from $276.3 billion
in 2001 to $940 billion in 2023 (3.4x), and $1.4 trillion by the end of 2024 based on projected
growth, reflecting an increase of 408% (5x). The external debt increased from US$1.2 billion in
2001 to a projected US$2.8 billion for 2024, reflecting an increase of 137% (2.4x). Public sector
net foreign sector assets increased from US$187 million in 2001 to US$2.8 billion in 2023 and
based on 2024 projections, US$4 billion by the end of 2024, reflecting an increase of 2,080%
(22x) (Fig.1). For the same period, GDP increased from $133 billion in 2001 to $3.9 trillion in
2023 and is projected to reach $5.3 trillion at the end of 2024, reflecting an increase of 3,834%
(39x).
Suffice it to state, other key debt capacity and debt coverage factors have outpaced the level of
growth in the total stock of public debt for the period 2001-2024. To this end, the nominal value
of the total public debt is projected to increase by five-fold (5x) since 2001, of which external
debt will increase twofold (2x) since then. Nevertheless, for the same period GDP is projected to increase by nearly fortyfold (39x); non-oil GDP by tenfold (10x); net foreign assets by twenty- twofold (22x); and exports by nearly fortyfold (38x).
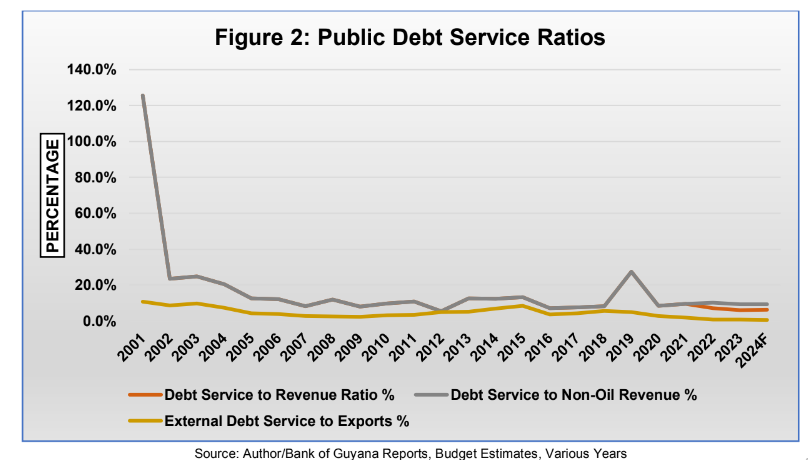
As shown in (fig.2), over the last two-decades the public debt service-to-revenue ratio fell from
a high of 125.6% in 2001 to a record low of 6.2% in 2023 and based on projections, 6.3% for
2024. The debt service-to-non-oil revenue in 2023 was 9.5% and in 2024 is projected to decline
by 10 basis points (bps) (9.4%). External debt service-to-exports ratio has declined from 11% in
2001 to 0.8% in 2023 and is projected to decline by 20 bps (0.6%) in 2024.
Private Sector Debt Indicators, Total Debt Relative to GDP
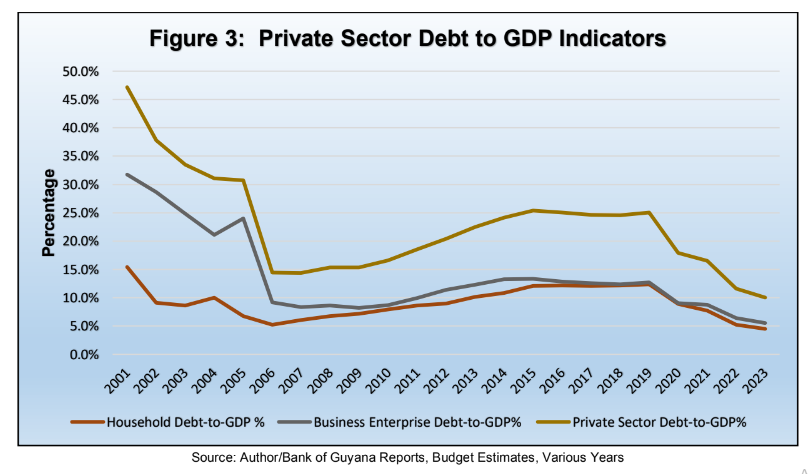
Private sector debt is comprised of households and business enterprises debt. As illustrated in
(fig.3), private sector debt-to-GDP ratio fell from 47% in 2001 to 10% in 2023. Household debt
fell from 15% in 2001 to 4.5% in 2023, while business enterprises debt fell from 32% of GDP to
5.5% of GDP in 2023.
In nominal terms, total private sector debt increased sixfold since 2001 (from $99b to $392b),
household debt increased nearly ninefold (from $46b to $176b), and business enterprises debt
increased by fivefold (from $53b to $216b).
As shown in (fig.4) below, total debt-to-GDP ratio (private sector debt + public debt) fell from a
high of 254% in 2001 to 34% in 2023.
In nominal terms, total debt increased by nearly fourfold (3.9x) since 2001 to 2023 (from $339b
to $1.3t).
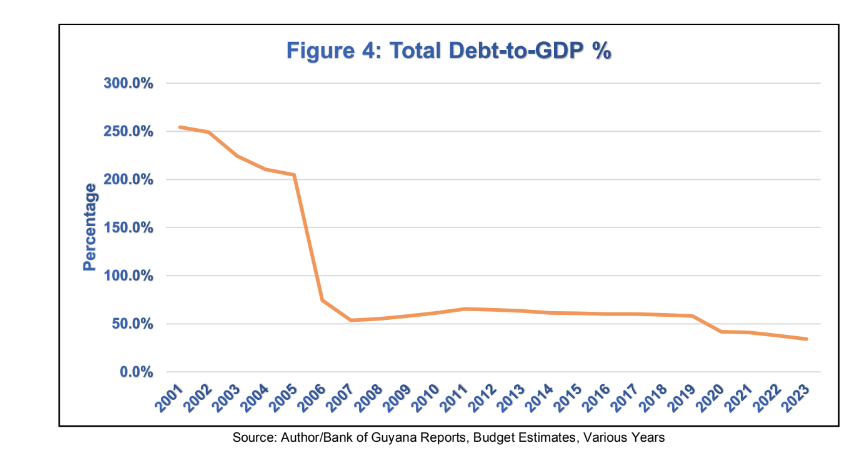
The country’s total stock of debt fell from 264% of GDP in 2001 to 35% of GDP at the end of
2023. In nominal terms, total debt increased fourfold (292%) from $352b to $1.4t (fig 4).
Note:
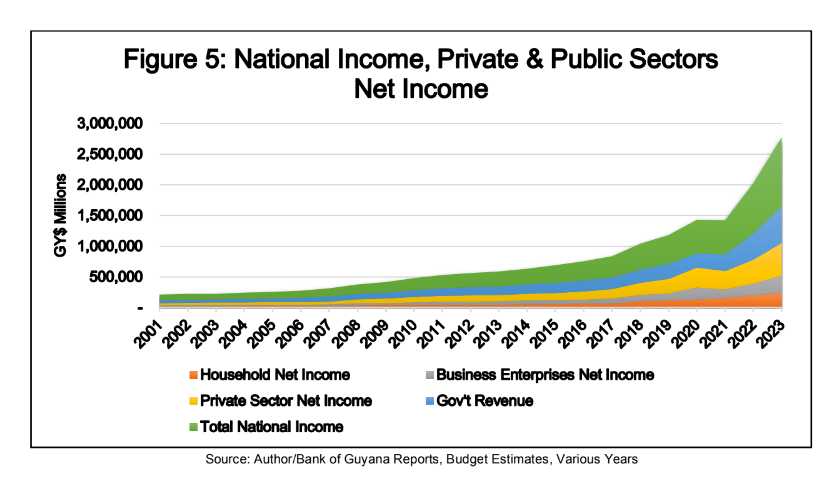
1. National Income = Private Sector Income + Gov’t Revenue.
2. Total Debt = Public Sector Debt + Private Sector Debt.
National Income
For the period under review (2001-2023), national income increased thirteenfold (1209%) from
$86 billion in 2001 to $1.12 trillion in 2023, representing nearly 30% of GDP (fig.5). Net
household income increased twelvefold (from $20b to $241b) and business enterprises income
increased eighteenfold (from $16b to $286b).
Conclusion and Summary
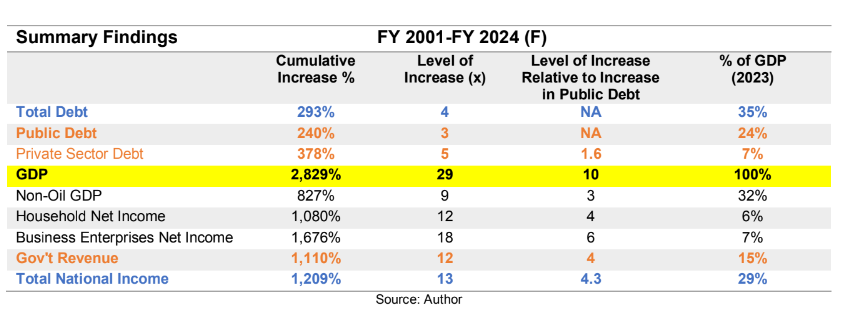
Over the last two decades (2001-2023), total public debt increased threefold (from $276b to $940b). Considering this, it is worth noting that for the same period, GDP (the economy’s productive output) increased by nearly thirtyfold (2,829%) or 10x the level of increase relative to public debt; non-oil GDP (the non-oil economy’s productive output) increased ninefold (827%) or 3x the level of increase relative to public debt; central government revenue increased twelvefold (1,110%) or 4x the level of increase relative to public debt; household net income increased twelvefold (1,080%) or 4x the level of increase relative to public debt; business enterprises net income increased eighteenfold (1,676%) or 4x the level of increase relative to public debt; and altogether, national income increased thirteenfold (1,209%) or 4x the level of increase relative to public debt.
The level of debt employed is relative to other factors such as current levels of income and productivity as well as future income earning potential, based on the investments undertaken therefor. In light of the foregoing, the economy’s productive, income and/or wealth generating capacity have far outpaced the level of debt undertaken that was partially attributed to these outcomes. Therefore, it is safe to conclude that Guyana’s public debt indicators are well below the low-risk category in accordance with the IMF risk profile benchmarks, whereby countries with a debt-to-GDP ratio of >50% are considered low risk, 50-90% are considered moderate risk and <90% are considered high risk. To this end, public debt-to-GDP ratio is 24% as of 2023, which is projected to increase by three (3) percentage points at the end of 2024. The public debt service indicators are also well within the low-risk range, with a debt service-to-revenue ratio of 6% and non-oil revenue of 9.5%, down from a high of 125% in 2001.
Moreover, Guyana’s total debt, which includes both public and private sector debt represented
35% of GDP at the end of 2023. This is 203 percentage points below the global debt-to-GDP as
of 2022, which stood at 238%. The global public debt-to-GDP was 92% in 2022, whereas
Guyana’s public debt-to-GDP is less than 30% of GDP, about 65 percentage points below the
global level.
Taken together, all of Guyana’s debt indicators are well within the low-risk range and
more importantly, far below the global levels. This trajectory is expected to remain in the
low-risk range over the near to medium term.