

 BUDGET 2026 ANALYSIS")
Household Income Transformation (2010-2025)
From remittance dependence to domestic earnings and State-led social support — evidence of policy driven welfare restoration under PPP/C Government
Date: January 30, 2026 Article No: 01/2026 Author: Joel Bhagwandin
SphereX Professional Services Inc.
Executive Context
This analysis is situated within SphereX’s Fiscal & Investment Outlook 2026–2030 and forms part of SphereX’s National Budget 2026 assessment. The household income series is extracted as a standalone storyline to demonstrate the macro-welfare impact of government policy over time— particularly under the PPP/C administration. The historical context is critical: when PPP/C assumed office in 1992, Guyana inherited severe macroeconomic distress, characterized by debt- to-GDP estimated near 900%, triple-digit inflation, extreme poverty, negligible reserve buffers in the financial sector, and domestic interest rates reportedly reaching 40%. Over the period 1992– 2015, a sustained reform and stabilization cycle improved macro fundamentals and expanded household welfare gains. However, the 2015–2020 period saw regressive policy reversals that compressed household welfare progress, requiring subsequent restoration and expansion of social support mechanisms after 2020.
Key Insights
- This Macro Note is an extract from SphereX Fiscal & Investment Outlook 2026–2030,prepared in support of SphereX’s National Budget 2026 analysis.
- Guyana’s household income structure shifted decisively between 2010 and 2025, transitioning from remittance-led support toward domestically generated income anchored in wages and government transfers.
- Remittances collapsed from 51% of total household income in 2010 to ~10% in 2025, signaling reduced reliance on external household support.
- Government social welfare support, subsidies and grants expanded sharply—from 1.6% of total household income (2010) to 38.1% (2025).
- When remittances are excluded, social security + social welfare support rose from 28% of household income excluding remittances (2010) to 51% (2025), reflecting a structural shift toward state-led household cushioning.
- This welfare strengthening occurred alongside rising fiscal risk indicators: current expenditure increased from 106% of non-oil revenue (2021) to 143.9% (2026), warranting containment strategies to preserve macro sustainability. Current expenditure rose from 106% of non-oil revenue (2021) to 143.9% (2026), up from <80% of current revenue in the pre-oil era, signaling a shift from a conservative fiscal posture to a moderated-risk recurrent spending profile.
- Understatement bias: Household income estimates are conservatively understated due to exclusions of tax-free income/allowances, selected subsidy programmes (e.g., CHPA support, mortgage interest relief), and the informal economy (estimated ~30% of non-oil GDP in IDB studies). Accordingly, the observed structural shift is directionally robust and likely larger in reality.
- Conclusion: Guyana’s household income model has structurally improved, shifting from remittance dependence toward wages and state-led support; however, the transfer-driven cushioning now represents a large recurrent fiscal commitment that must be managed to preserve macro sustainability.
- Recommendation: To contain fiscal risks while protecting welfare gains, the Budget 2026 framework should prioritize (i) containment of current expenditure growth, (ii) improved targeting and rationalization of subsidies/transfers, and (iii) productivity-enhancing capital investment to expand the non-oil revenue base and reduce long-run transfer dependence.
-
Structural Shift in Household Income Composition (2010– 2025)
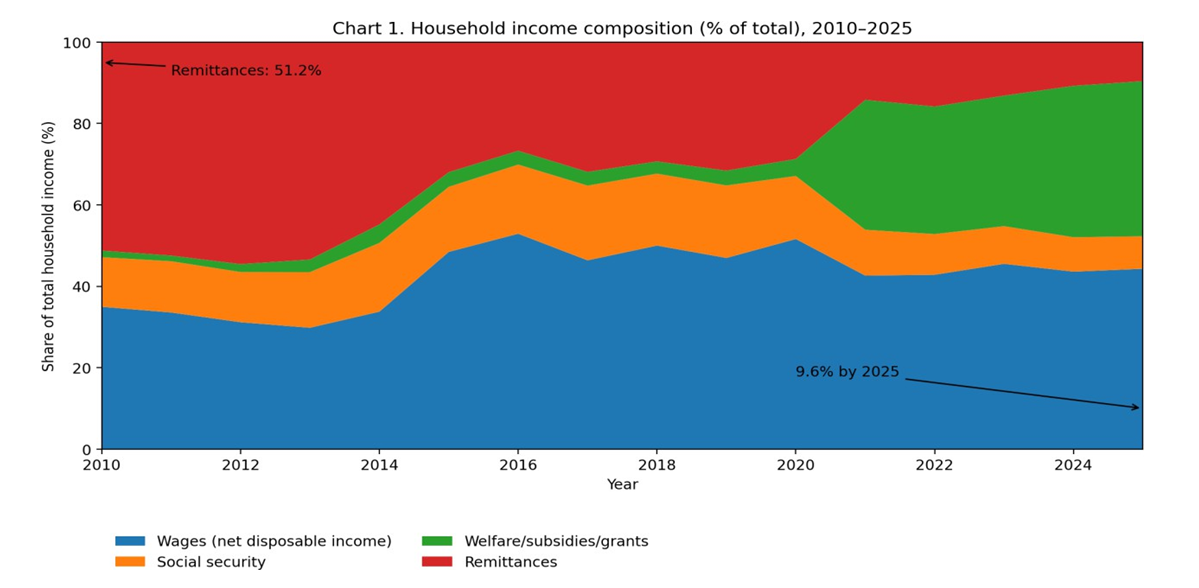
The evolution of household income composition over 2010–2025 reflects a major structural transition in Guyana’s welfare and income model. In 2010, remittances accounted for approximately 51% of total household income, indicating significant external dependence. By 2025, this share had fallen to roughly 10%, with the income structure increasingly dominated by wages and government-linked transfers. This shift is not simply a remittance decline story; remittances grew modestly in nominal terms (GYD 63bn to GYD 90bn), but domestically generated income expanded far faster.
Figure 1: Household income composition
2. The Transfer-State Expansion: Social Support as a Dominant Cushion
A defining feature of the post-2020 period is the step-change expansion in welfare/subsidies/grants. This category rose from 2.1% of total household income in 2020 to 38.1% by 2025. The new income regime therefore reflects not only wage strengthening but also a deliberate policy shift toward state-led cushioning of household purchasing power.
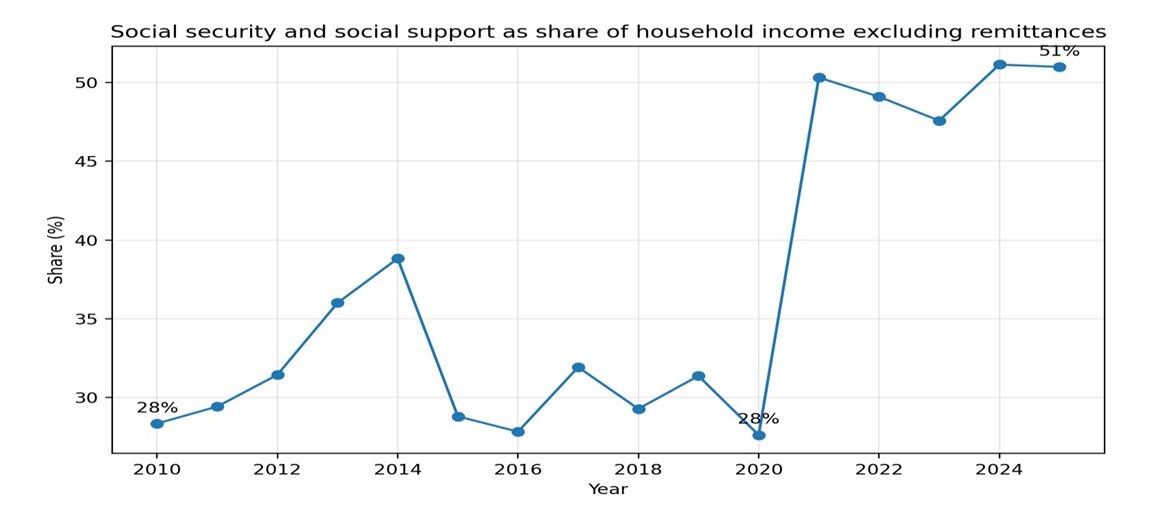
A more revealing indicator is the share of social support within household income excluding remittances. This measure isolates the domestic income base and demonstrates the scale of transfer deepening. In 2010, social security + social welfare support accounted for 28% of household income excluding remittances. This remained broadly unchanged in 2020 (27%) but surged to 51% by 2025—indicating that more than half of domestically generated household income is now supported by the transfer architecture.
Figure 2: Social security and social support as share of household income excluding remittances
3. Macro-Fiscal Lens: Household Income as % of Non-Oil GDP
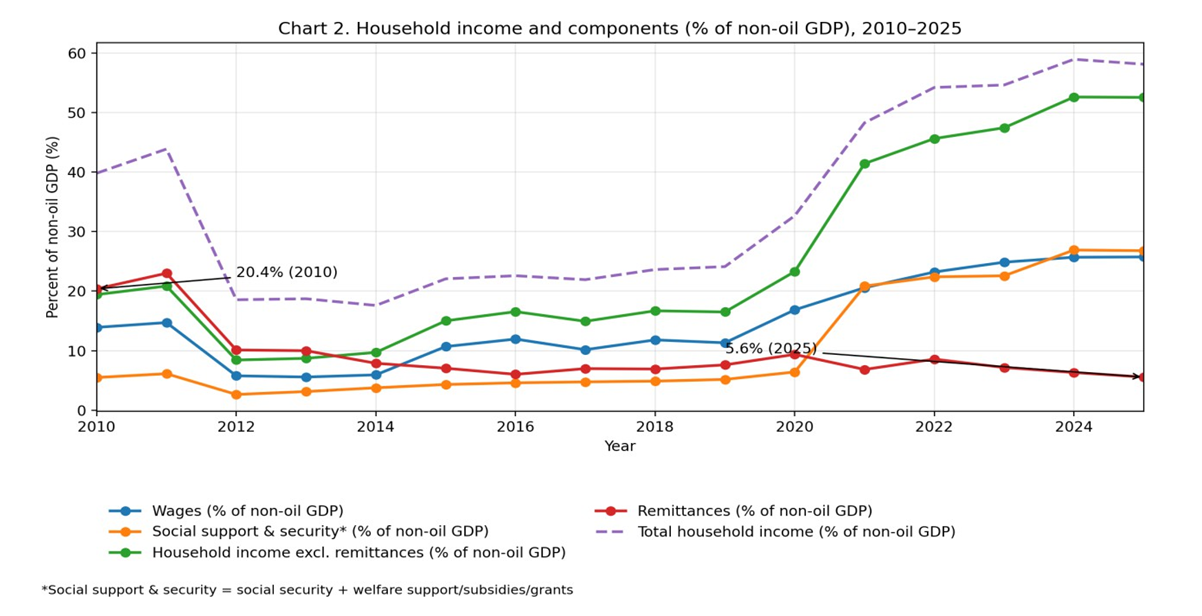
Reframing household income relative to non-oil GDP provides a macro-fiscal sustainability lens. Total household income rose from 39.8% of non-oil GDP in 2010 to 58.1% in 2025. At the same time, remittances fell from 20.4% to 5.6% of non-oil GDP. Wages rose from 13.9% to 25.7% of non-oil GDP, while social support & security rose from ~5.5% to ~26.8%.
Figure 3: Household income sources
4. Fiscal Risk and Sustainability Backdrop (Budget 2026 Context)
While household income strengthening reflects welfare gains, the fiscal mechanism driving these outcomes introduces moderated but rising fiscal risks. Current expenditure has expanded sharply: current spending increased from 106% of non-oil revenue in 2021 to 143.9% in 2026, up from
<80% of current revenue in the pre-oil era. In contrast, pre-oil benchmarks indicate a more conservative posture (approximately 78% in 2011 and 86% in 2019). This outturn suggests that the fiscal stance has shifted from a low-risk posture to a moderated-risk posture in the oil era.
For fiscal risk analysis, oil revenues should be excluded from the core sustainability lens, as these are governed under the Natural Resource Fund Act (NRF Act) and are intended to finance developmental capital investments, expand productive sectors, and accelerate diversification. Over-reliance on oil inflows to fund recurrent current expenditure risks embedding structural obligations that may be difficult to unwind.
Notwithstanding, Guyana’s fiscal resilience framework provides buffers. Total net reserves across the financial sector (NRF + Bank of Guyana + banking system) are estimated to be equivalent to approximately five months of import cover and about 1.2x the sovereign stock of external debt. These buffers strengthen macro stability but do not eliminate the need for fiscal containment strategies.
5. Conclusion and Recommendations
Guyana’s household income transformation over 2010–2025 represents a structural improvement in welfare resilience and domestic income quality. The collapse in remittance dependence and the rise in wages and state transfers demonstrate a transition toward a more domestically anchored income model. However, the rapid deepening of transfers implies rising recurrent fiscal commitments. Maintaining these gains while preserving macro sustainability requires disciplined fiscal management, improved targeting, and employment-led growth.
- Contain current expenditure growth by tightening recurrent spending envelopes and prioritizing efficiency gains across agencies.
- Strengthen targeting of welfare/subsidy programs to ensure transfers are progressive, fiscally efficient, and linked to vulnerability criteria.
- Institutionalize a medium-term fiscal framework anchored on the non-oil primary balance to reduce structural dependence on oil inflows.
- Prioritize capital expenditure with high productivity multipliers to expand non-oil revenue capacity and reduce long-run transfer dependence.
Expand transparency and monitoring of quasi-fiscal subsidies (tax expenditures) to improve accountability and fiscal planning.
6. Data Sources and Methods
Data sources are drawn from:
- National Budget Estimates, various years, Ministry of Finance
- National Insurance Scheme Annual Reports, various years
- Guyana Revenue Authority Annual Reports, various years
- Bank of Guyana Annual Reports, various years
Net disposable income (wages and salaries) is calculated using the effective income tax rate approach: Personal income taxes ÷ effective tax rate = taxable income; taxable income − personal income taxes = net disposable income. This calculation excludes tax-free income and allowances; therefore, net income used is reasonably understated by those unquantifiable amounts.
Definitions and exclusions:
- Social security = old age pension + service pension.
- Social welfare support, subsidies and grants include indirect subsidies derived from foregoing tax revenues via fiscal measures to combat rising prices (e.g., removal of excise taxes on fuel, VAT measures, increase in income tax threshold, reduction in income tax rates).
- Subsidies exclude home builders subsidies through the CHPA to support affordable home ownership.
- Estimates exclude mortgage interest relief to first-time mortgage holders (approximately GYD 0.3mn–0.9mn annually).
Altogether, these exclusions understate the true reflection of household income. The informal economy—estimated at ~30% of non-oil GDP according to IDB studies—also implies household income may be understated.
About SphereX
SphereX is a specialized finance and capital advisory firm built on deep expertise in banking, capital markets, and investment structuring. The firm was founded to support clients with disciplined, evidence- based advisory across financial strategy, investment appraisal, governance, and capital mobilization— particularly in complex, regulated, and capital-intensive environments. Over time, SphereX expanded into broader enterprise advisory services to meet evolving market needs and diversify delivery capacity. However, our core mandate has remained constant: enabling strategic growth by unlocking capital, strengthening decision-making, and improving financial outcomes.
Today, SphereX supports both institutions and private sector clients through a structured advisory model— grounded in rigorous analysis, confidentiality, and execution discipline.